
HSE Nexus
Module 03
Observations
Near-misses and hazards captured from the field, with the severity and stop-card analysis to act on them.
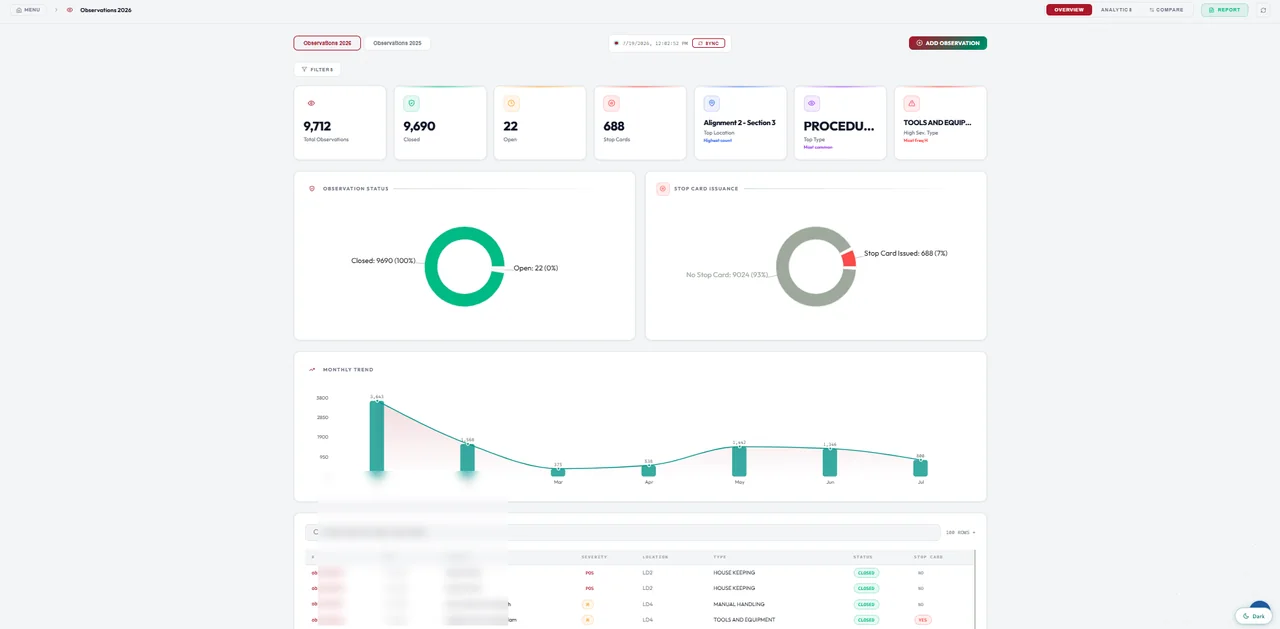
What it does
- Live on your own register
- Reads from your Google Sheet; observations added or edited in the dashboard are written back to it.
- The picture in seven numbers
- Total, open and closed observations, stop cards issued, top location, top type and the most frequent high-severity type.
- Graphical analysis
- Monthly, location and type trends, status split and stop-card issuance, plus dedicated high-severity and stop-card sections.
- Fast field logging with QR
- Generate a QR so crews can log an observation in seconds. It lands in the sheet and shows in the dashboard.
- Year by year
- Switch between years, such as 2026 and 2025, from the same screen.
- Top observers
- A dynamic leaderboard of your top observers.
- Presentation-ready reports
- Print reports with every chart included.
Linked features
Connects this module to the rest of the platform.
- Compare any two periods
- Set two date ranges, such as week over week, and see the change in KPIs, locations and observation types side by side.
- Logged from the Inspector app
- Field teams can log an observation in the app even without a QR code, and follow their own count and status live.Works withInspector app
See it running on your own equipment list.
Bring your permit register, your training records, or just your questions — we'll show you the live board.